
NYC job losses proportionately greatest among largest U.S. cities
COVID-19 Economic Update is a bi-weekly column prepared by economist James Parrott of the Center for New York City Affairs (CNYCA) at The New School, whose research is supported by the Consortium for Worker Education and the 21st Century ILGWU Heritage Fund. Read past installments here.
New York City’s Covid-19 payroll job loss was 13.6 percent over the first year of the pandemic, more than twice the 5.9 percent national job decline and greater than the job losses experienced in the next 14 largest U.S. cities. These data reflect the annual revision to the monthly establishment payroll employment data that was released by the New York State Labor Department on March 11th (see next item below). San Francisco’s 13.2 percent job loss and Los Angeles’ 12.1 percent decline were close behind New York City’s. The next five cities – Philadelphia, Boston, Miami, Washington, D.C., and Chicago – were clustered in the -9 to -10 percent range. Four cities among the 15 largest in the country – Riverside (CA), Atlanta, Dallas, and Phoenix – had smaller job declines than the nation overall.
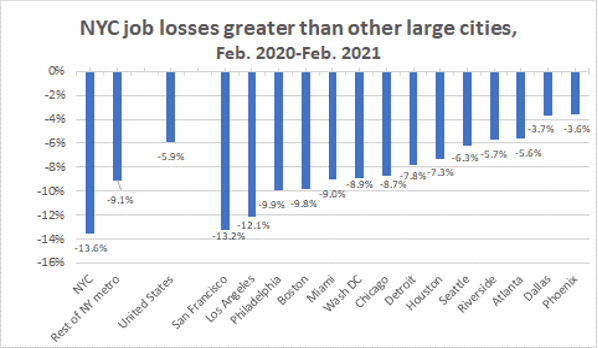
The New York City metropolitan area had 9.9 million jobs in February 2020, or 6.6 percent of the 151 million national job total. During the pandemic’s first year, the metropolitan area had an 11.2 percent job decline; the rest of the metro area outside of New York City saw jobs fall off by 9.1 percent compared to the city’s 13.6 percent decline. New York City had 3.1 percent of all U.S. payroll employment as of February 2020.
The Labor Department’s revised payroll employment data also revealed that New York City’s job losses in 2020 were greater than previously reported. In our February 12th report, New York City’s Covid-19 Economy Will Not Snap Back, we wrote that the February-December 2020 payroll job loss was 507,000, a decline of 10.9 percent. The job level for last December has now been revised downward by the Labor Department to show a drop of 575,000 from February, a revised job falloff of 12.3 percent. The annual revisions are based on administrative data compiled in connection with the payment of employer payroll taxes for unemployment insurance purposes. (The employment figures cited here are not adjusted for seasonal effects since pandemic-related impacts have been much greater than the usual pattern of seasonal ups and downs.)
The January employment levels dropped further because there had been some seasonal hiring in November and December that then ended. Even with a moderate 40,000 increase in February employment levels, the February 2020 to February 2021 New York City change shows a drop of 635,000 jobs, or 13.6 percent. The table below shows these 12-month job changes for individual industries grouped into the three categories (Essential, Face-to-Face, and Remote-Working) we feel best reflect the predominant dynamic caused by Covid-19 economic impacts.
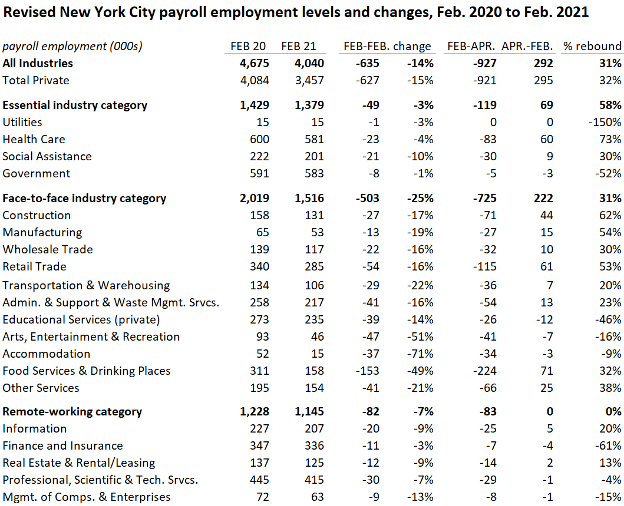
The revised data underscore the now-commonplace observation that the Face-to-Face industries have borne the brunt of the adverse pandemic economic and employment impacts. Led by the steep job losses in leisure and hospitality and the arts and entertainment industry, Face-to-Face industries as a group have seen a 25 percent drop in employment compared to a seven percent decline in the Remote-Working industries and a slight three percent decline in the Essential category. Nearly four out of every five New York City jobs lost over the past year have been in the Face-to-Face industries, where most workers do not get paid if they don’t work and where only a tiny fraction of workers can do their jobs remotely.
The annual employment revision saw a handful of industries with significant downward revisions while a smaller number of industries had upward revisions. Two of the hardest-hit industries had sharp downward revisions: hotel employment was revised down by 44 percent and eating and drinking places had a 12 percent downward revision. On the other hand, the other among the three hardest-hit industries –arts, entertainment, and recreation – had a 44 percent upward revision in its job numbers. However, as the above table shows, this industry still suffered a 51 percent job loss over the past year.
Child care employment was revised down by 21 percent and the revised job levels for temporary employment agencies were 30 percent lower. It had earlier been thought that given its essential role, employment had been fairly stable in grocery stores and drug stores; however, the more definitive administrative data resulted in a 10 percent downward revision in the number of grocery store jobs and a 17 percent negative change in drug store employment. There was a surprising upward revision elsewhere in the retail sector, with clothing store employment revised up by 43 percent. Among upward revisions in the Remote-Working industries, employment in publishing was reported to be 10 percent greater in the revised data, and there were upward revisions of five percent in investment banking, six percent in computer services, and eight percent in management consulting.