
Employment lags significantly in the city’s face-to-face industries, some remote-working industries also lag, and several industries with job gains pay low wages
COVID-19 Economic Update is a bi-weekly column prepared by economist James Parrott of the Center for New York City Affairs (CNYCA) at The New School, whose research is supported by the Consortium for Worker Education and the 21st Century ILGWU Heritage Fund. Read past installments here.
A closer look at how New York City’s pandemic-era job changes by industry compare with the U.S. as a whole can be captured in these three takeaways:
- Our face-to-face industries are much slower to rebound than nationally;
- While a few of New York City’s remote-working industries have gained jobs, the combined gain is more than offset by losses in other remote-working sectors; and
- The four industries where jobs are increasing the most in the city all pay very low wages, and some reflect poor working conditions.
*=high NYC location quotient; #=low NYC location quotient

New York City’s pandemic jobs deficit, reflecting the change from February 2020 to December 2021, is more than four times the national shortfall (8.8% vs. 2%). Three-fourths of the city’s 421,000 jobs deficit stems from the face-to-face industries shown in chart 1. In every case, the employment decline is much greater than the national average. For example, in accommodation and food services, the city’s 33 percent loss is three times greater than the national 11 percent loss. The 122,000 job loss in this sector accounts for 29 percent of the city’s total pandemic job loss. At 51 percent, the private transit and ground passenger services industry the steepest job loss. This industry includes bus transportation and is closely tied to tourism and airport-related business (this does not include MTA services that are included under government employment.)
Only three of the 10 industries in the above chart have a greater-than-proportionate presence in New York City as measured by a “location quotient” (LQ) that is greater than 1.2. New York City LQs are calculated as an industry’s share of total New York City employment relative to that industry’s share of total employment at the national level. For this analysis, LQs were calculated for the pre-pandemic month of February 2020.
In the charts in this Update, we use an “*” to indicate industries with a LQ greater than 1.2, and a “#” to indicate industries with a LQ less than 0.8. Industries that are not marked have a LQ between 0.8 and 1.2, that is, fairly close to the national average. Thus, the city has particularly high shares of employment in transit and ground passenger services; arts, entertainment and recreation; and colleges and universities, but low shares of construction, manufacturing, services to buildings, and retail and wholesale trade.
Contrary to what is often thought, New York City’s LQ for accommodation and food services is only 0.84, signifying a somewhat less-than-proportionate presence of that sector in the city—it was a big employer before the pandemic at 373,000 jobs, but not an industry heavily concentrated here relative to the city’s large overall employment base. We have a lot of jobs in hospitality, but we have very high concentrations of jobs in many of the remote-working industries shown in the next chart.
Chart 2 looks at several industries that didn’t experience sharp pandemic-related job declines since most work in these industries was able to be performed remotely. There have been slight job gains in the four industries at the top of the chart that are all tech-related; however, the combined February 2020-December 2021 job gain for these industries was only 8,000 jobs.
On the other hand, the three remote-working industries at the bottom all have fared much worse than their counterparts nationally, and together these three industries have shed 36,000 generally high-paying jobs. There has been a 16,000 decline in the city’s finance and insurance sector, the second largest employer (after accommodation and food services) analyzed in this Update, and slightly larger than retail trade. The finance and industry sector has a LQ of 1.7, and motion picture production has a very high 4.2 LQ. Advertising has a LQ of 4.8, the highest of any sizable New York City industry, and it is one of only two industries in chart 2 where an industry fared better in the city than nationally (publishing is the other).
*=high NYC location quotient; #=low NYC location quotient
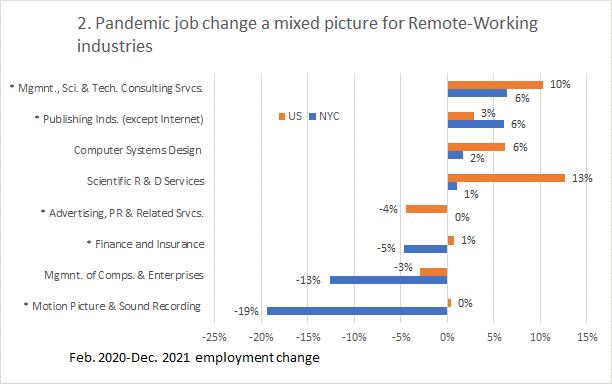
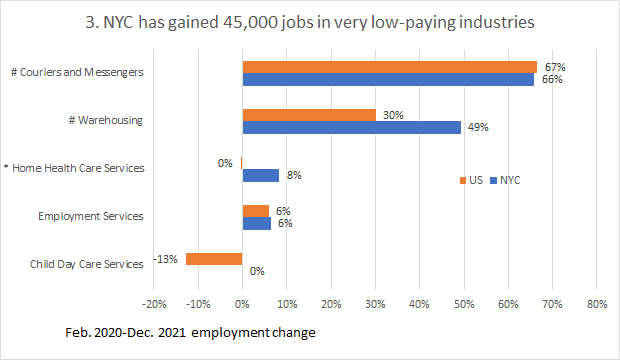
Chart 3 shows four industries that have added a total of 45,000 since the onset of the pandemic. The two at the top that have grown the fastest are related to pandemic business restrictions and the acceleration of the e-commerce trend. Delivery services are the main component of couriers and messengers, and distribution centers are part of the warehouse industry. As noted by their low New York City LQs, these two industries were relatively minor employers locally before the pandemic. As of December, there were an estimated 35,000 jobs in each of these two industries in New York City; warehousing has added an estimated 7,000 jobs during the pandemic and delivery services are up 14,000 jobs.
The single industry adding the most jobs since the onset of the pandemic, however, has been home health care, which has added 18,000, bringing its December 2021 level to 237,000. Most of the jobs added in these three industries pay $30,000-$40,000, among the lowest wages in the city. The employment services industry in New York City has added nearly 6,000 jobs, growing in line with the industry nationally. In the three years before the pandemic, there was rapid job growth in the “professional employer organization” (PEO) subindustry within employment services, and a sharp decline in the first year of the pandemic. PEOs are employee outsourcing firms, whose use in the city skyrocketed by 350 percent from less than 16,000 in 2016 to 55,000 employees in 2019. Given this trend, it is likely that much of the recent growth in employment services has been among PEOs.
*=high NYC location quotient; #=low NYC location quotient
It is also likely that there has been additional job growth in delivery operations that is not reflected in the payroll employment numbers. For example, the app-dispatched restaurant delivery workers working for companies such as UberEats or Doordash are classified by those companies as independent contractors and are not hired as payroll employees. Since the start of the pandemic, the number of app-dispatched delivery workers has probably grown by 20,000-30,000 in New York City given the rapid growth in delivery business reported by the companies. Some of the growth in PEO employment may also be to staff distribution centers and delivery services.
# # #