
Even with sizable upward annual employment revisions, New York City’s pandemic jobs deficit remains more than three times the national average
COVID-19 Economic Update is a bi-weekly column prepared by economist James Parrott of the Center for New York City Affairs (CNYCA) at The New School, whose research is supported by the Consortium for Worker Education and the 21st Century ILGWU Heritage Fund. Read past installments here.
Despite the Omicron variant, New York City’s seasonally adjustment payroll employment level rose by 36,400 in January. The January gains surpassed the 24,000 average monthly gains in 2021, and was the largest monthly gain since last July.
The big story in the March 10th Labor Department release of the annual benchmark employment revisions is the significant upward revision in employment over the past year-and-a-half. The December 2021 citywide nonfarm employment total was revised upward by 103,000 compared to the preliminary, pre-benchmarked data released in January. The Labor Department annually revises the employment data for the prior 18 months in March of each year based on more comprehensive payroll employment data from unemployment insurance administrative data.
On an annual average basis, the city’s total employment level was revised upward by 60,400 for 2021 (1.4 percent), with a government sector downward revision of 13,200 (-2.2 percent) and a private sector 73,600 (+2.1 percent) upward revision.
New York City’s unemployment rate for December was also revised significantly downward from 8.8 percent to 7.4 percent. While the city’s unemployment rate notched slightly higher to 7.6 percent in January, that increase resulted from growth in the city’s labor force outpacing employment growth. Given recent concerns about hesitancy on the part of workers to return to work, the 28,000 labor force increase in January is a welcome sign. The city’s January labor force participation rate improved to 59.5 percent, still below the pre-pandemic level of 60.6 percent from February 2020. (A future Update will examine the latest trends in labor force participation.)
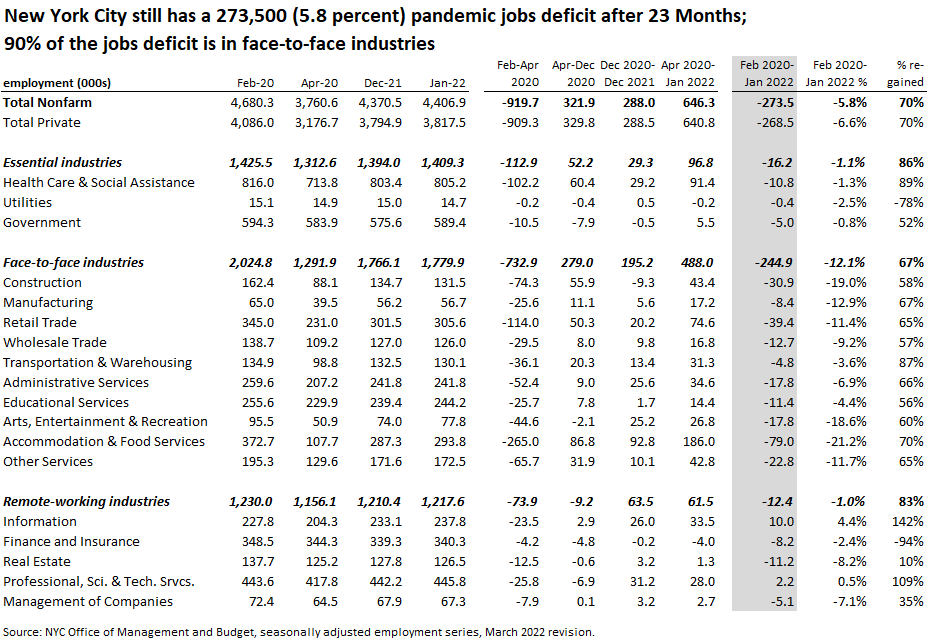
However, even with the upward employment revision, New York City’s pandemic payroll jobs deficit on a seasonally adjusted basis was 273,500 as of January, 5.8 percent below the February 2020 level, and more than three times as great as the nation’s 1.8 percent pandemic jobs deficit. New York City has regained 70 percent (vs. 87 percent for the nation) of the jobs lost in the first two months of the pandemic.
The Current Population Survey-based labor force series shows that New York City resident employment was 437,000 lower in January 2022 than in February 2020 on a seasonally adjusted basis. That this figure is higher than the net 273,500 payroll employment decline likely reflects the concentration of city residents in hard-hit face-to-face industries that have borne 90 percent of the payroll job as of this January.
All but a handful of industries had upward employment revisions in 2021, with the chart below showing the most significant revisions, including five industries with downward revisions.
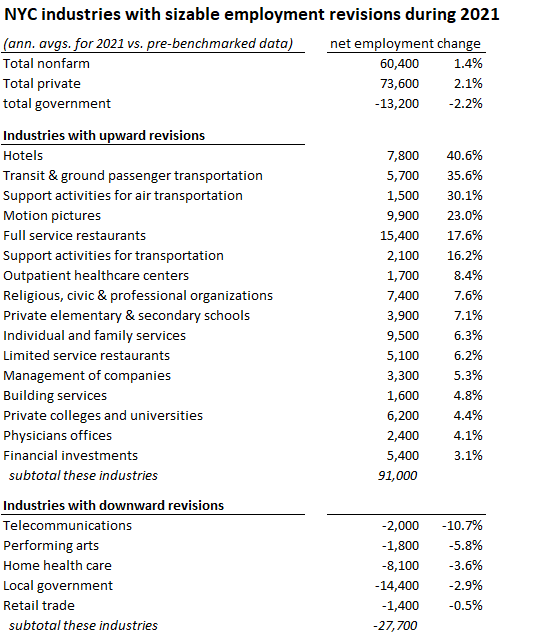
Many of the industries that had been hardest hit by pandemic-related closures saw substantial upward revisions. Hotels, for example, which lost about two-thirds of its jobs initially, had its 2021 average employment level raised by over 40 percent. Full service restaurants showed the largest absolute upward revision, with the benchmark numbers raising the average 2021 employment level by 15,400 jobs (17.6 percent.) Motion pictures had the second largest upward revision of 9,900 or 23 percent, followed by individual and family services with an upward revision of 9,500 jobs, or 6.3 percent.
The revised employment numbers show that the net growth in home health care employment was not as strong as previously reported, with a downward revision of 8,100 lowering the net job gain to 5,000 since February 2020.
Even with the latest benchmark employment revisions, several New York City face-to-face industries have employment levels that are still down by double digit percentages compared to February 2020 as the chart below indicates. Accommodation and food services (i.e., hotels and restaurants) still tops the list with a 21 percent jobs deficit despite the large upward benchmark revisions. Construction and arts and entertainment employment are still down by 19 percent compared to pre-pandemic levels. The 13 percent decline in manufacturing jobs shows that local factories have not shared in the manufacturing resurgence taking place in other parts of the country. Employment in other services is off by 12 percent and retail trade jobs are down by 11 percent. Altogether, employment in face-to-face industries is 245,000 below February 2020.
# # #